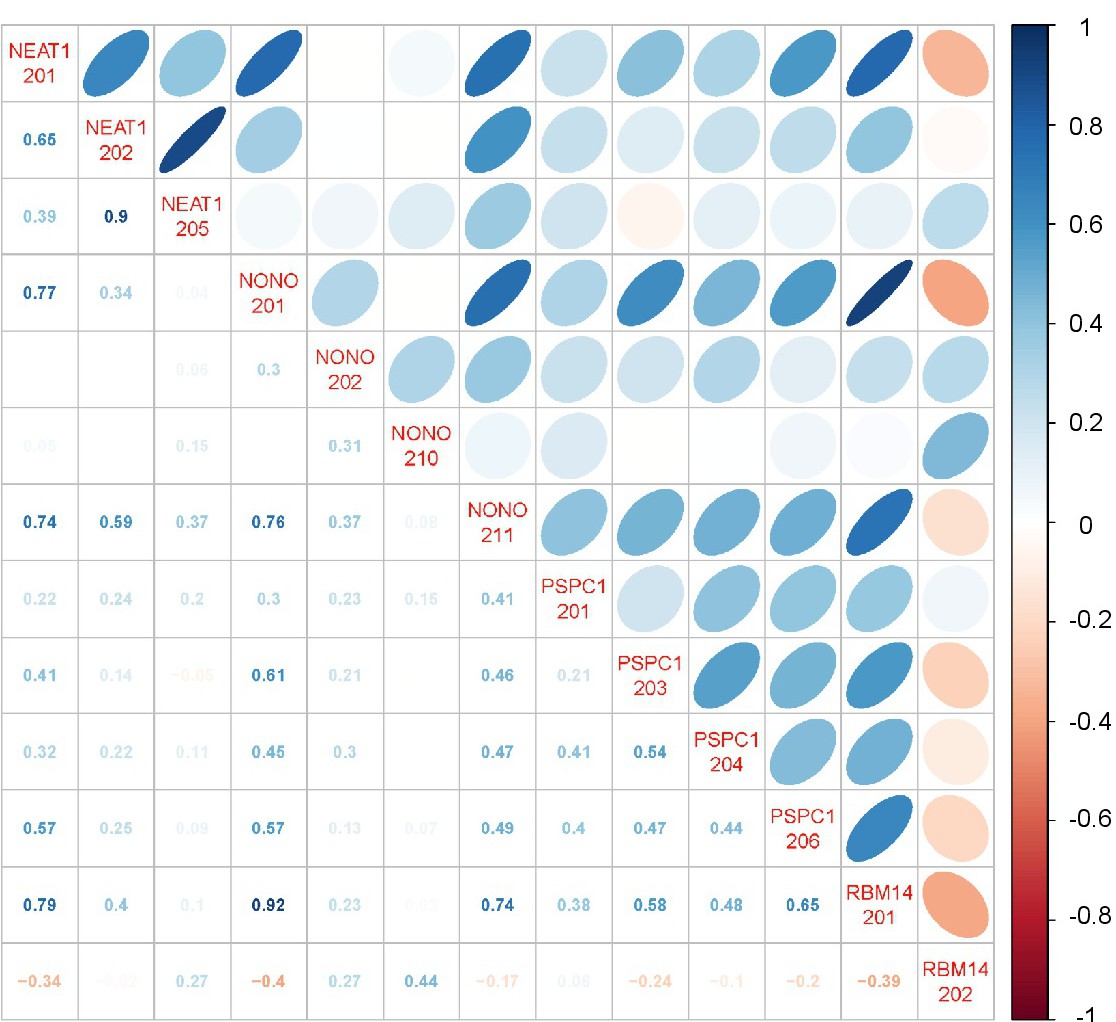
Fig. 5. Pairwise correlation of transcript variants with an average expression rate of log2(TPM + 0.001) > 0 of NEAT1, PSPC1, NONO, and RBM14. The lower triangle indicates correlation coefficients numerically, whereas the upper triangle depicts them as ellipsoids. Blue indicates positive and red negative correlation as reflected by the colour legend on the right-hand side.
